
FIELD NOTES / 技术札记
服务监控
基于 docker 搭建 node-exporter + Prometheus + Grafana 服务器监控平台
安装
安装 node-export
docker run -d --restart=always -p 9100:9100 prom/node-exporter
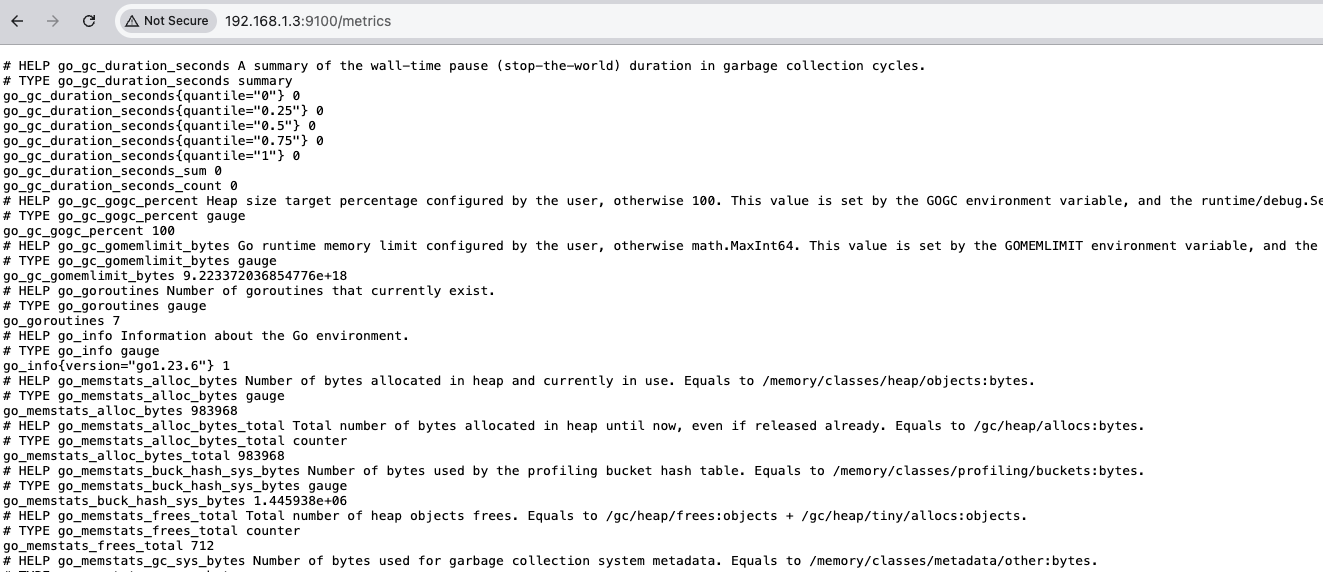
验证:访问 http://服务器IP:9100/metrics
安装 Prometheus
准备 /disk/app/prometheus/prometheus.yml,IP地址 替换成 node-exporter 所在服务器地址
global:
  scrape_interval: 60s
  evaluation_interval: 60s

scrape_configs:
  - job_name: prometheus
    static_configs:
      - targets: ['localhost:9090']
        labels:
          instance: prometheus

  - job_name: linux
    static_configs:
      - targets: ['IP地址:9100']
        labels:
          instance: localhost
创建 docker 容器 docker run -d --restart=always -p 9090:9090 -v /disk/app/prometheus/prometheus.yml:/etc/prometheus/prometheus.yml prom/prometheus
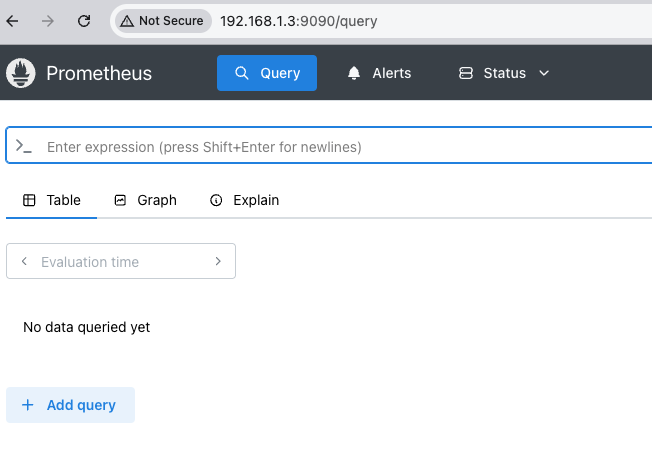
验证:访问 http://IP地址:9090
安装 grafana
docker run -d --restart=always --name grafana -p 3000:3000 grafana/grafana
访问 192.168.1.3:3000,用户名密码都是 admin
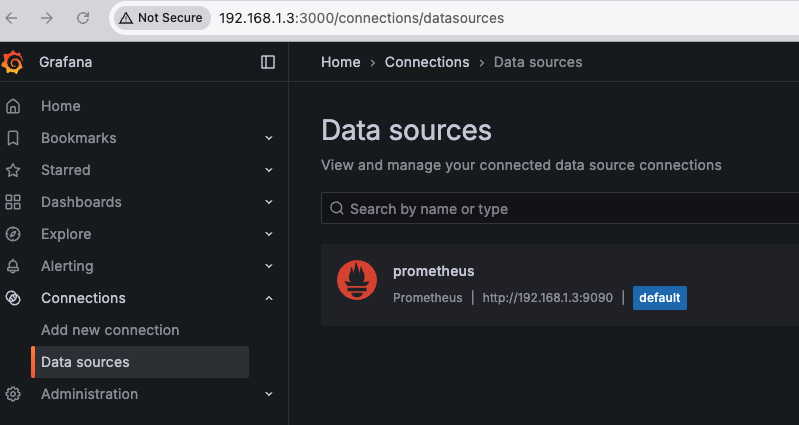
添加数据源
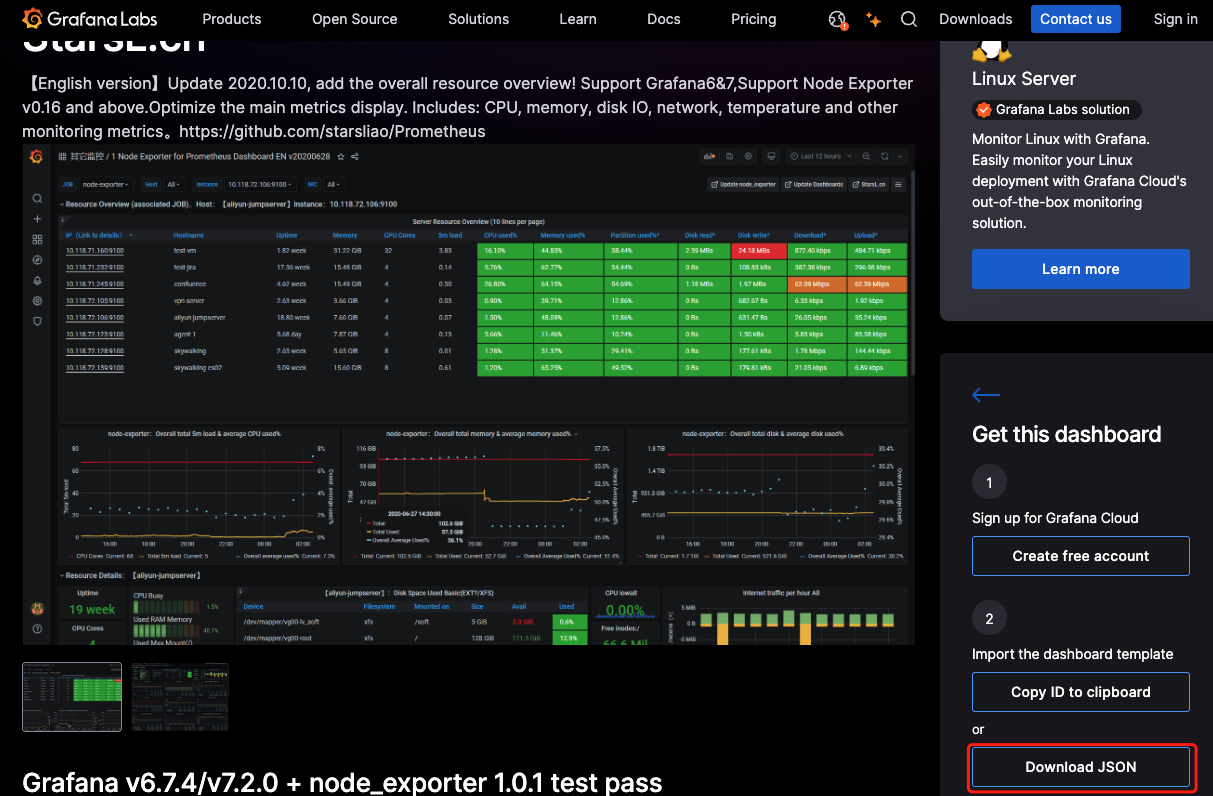
下载ID为11074的模板文件
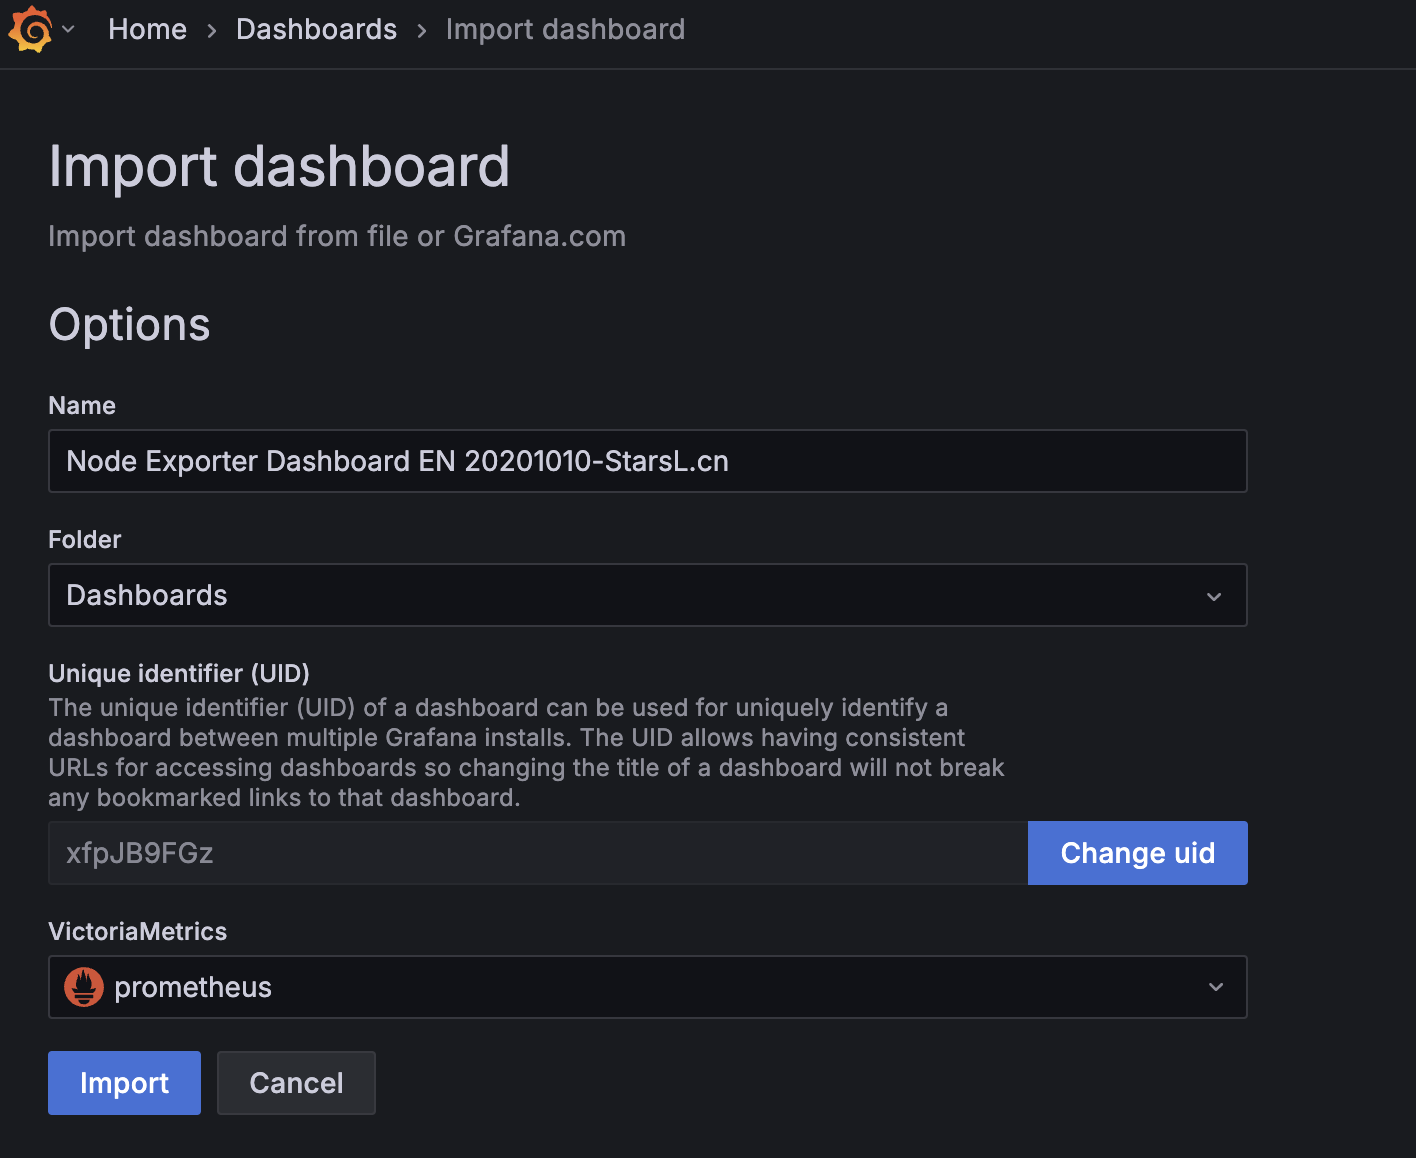
 使用下载的模板文件创建仪表盘
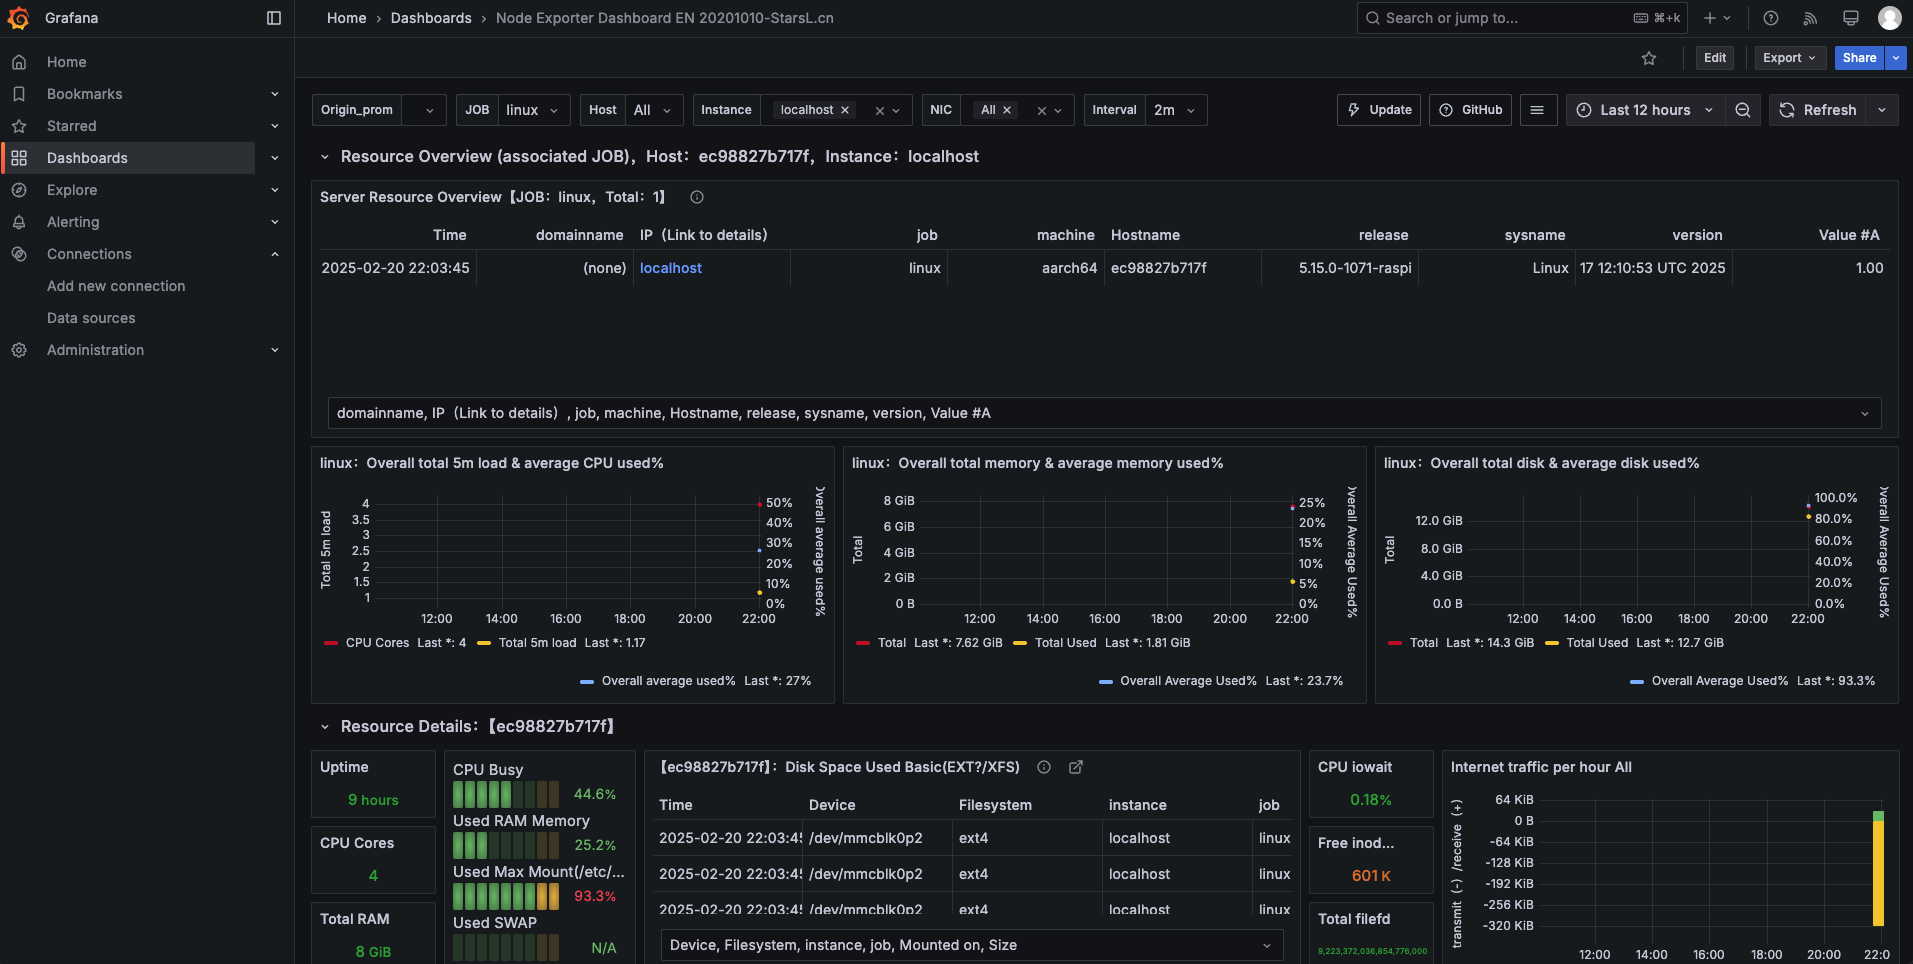
 效果
效果